
Today the new Office for Health Improvement and Disparities (OHID) has published new estimates, based on an updated methodology, on the deaths and hospital admissions caused by alcohol. The figures are around 23% lower than previously published but unfortunately, this doesn’t mean that the health risk due to alcohol is lower than it was before.
Why have the estimated numbers of deaths and hospital admissions caused by alcohol gone down so sharply?
In England, alcohol misuse is the biggest risk factor attributable to early mortality, ill health and disability for people aged 15 to 49 years and is the fifth biggest for all ages. 30% of men and 15% of women drink in a way that increases their risk of ill health over their lifetime.1
Alcohol causes, or can contribute to the development of, many health conditions, including stroke, high blood pressure, depression and several cancers. Conditions like these, where alcohol causes some but not all cases, are known as alcohol-related conditions.
There are 18 conditions where alcohol is the sole cause, including alcohol-related liver disease (ARLD), alcohol poisoning and alcohol dependence syndrome. These are known as alcohol-specific conditions.
Estimating the health impact of alcohol-specific conditions is straightforward. Every alcohol-specific condition is caused wholly by alcohol so we can simply count these admissions and deaths.
For alcohol-related conditions, academics have been able to use high quality research evidence to estimate what proportion of cases of a health condition are caused by alcohol. These are called alcohol attributable fractions (AAFs), and we can use them to estimate the impact of alcohol on health. As research progresses understanding, we need to update the AAFs. Public Health England (PHE) reviewed and updated these AAFs and published an update report in June 2020.
AAFs are calculated by using the relative risk of specific diseases among people who drink alcohol compared with those who do not, and the prevalence of alcohol consumption in the population. These AAFs are applied to the number of deaths and hospital admissions for the relevant conditions, to estimate the number that are caused by alcohol.
The previous AAF estimates were calculated using the best available data in 2013. The AAF update report in 2020 found that the relative risks for 29 conditions had changed and the prevalence of alcohol consumption had reduced since 2005. These changes mean that, at the population level, the estimate of the number of deaths and hospital admissions that we attribute to alcohol is lower than it was before.
It does not mean that the risk from alcohol consumption to individuals has decreased, the new estimates are mainly a reflection of people drinking less today than when the original estimates were made. The amount of death and disease caused by alcohol has not suddenly changed, it is the methodology and information that we used to estimate it that has.
The burden of alcohol-related death and ill health rose steadily from the 1970s, and over recent years has levelled out at what is an unacceptably high level of avoidable harm. Figure 1 shows the recent trend for alcohol-related mortality calculated using both the old and new methods. While the numbers calculated using the new method are lower, the direction of travel is broadly the same.
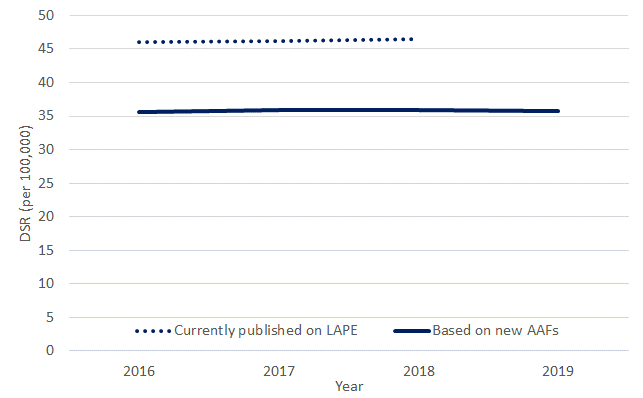
Figure 1: Alcohol-related mortality, new method compared to old method, England
As alcohol can be so damaging to health, wellbeing and society, it’s obviously a positive thing that England’s overall consumption of alcohol has fallen. However, before we become complacent, we should consider in more detail the alcohol consumption patterns across the population. If we look beneath the population-level trend, we can see data on consumption to suggest that many of the people who have chosen to drink less (or not at all) are those who were not at greatest risk of harm. It appears that many heavier drinkers, who are at most risk, have not reduced their alcohol consumption and may even have increased it.
It’s important to bear in mind that the change in method only affects estimates for alcohol-related conditions. Alcohol-specific conditions are not affected, so for example, the unprecedented 21% rise in deaths from alcohol-related liver disease in 2020 compared with the previous 2 years, reported by PHE in 2021, remains unchanged.
How long has this work been underway, and why publish now?
This work has been in the pipeline for 3 years. The revised AAFs for England, published by PHE in 2020 provided a thorough recalculation of the relationship between alcohol use and disease. And this, along with new data on consumption, showed that it was clearly time to update our calculations of alcohol-related deaths and hospital admissions. The initial proposals were consulted on in March 2021 and after a six week consultation, PHE published its response in September 2021.
Does that mean the past estimates were artificially high?
With the updated methodology, we have improved the accuracy of the estimate of deaths and admissions that are attributable to alcohol. Previously, PHE were using the widely accepted evidence at the time and once the new data was available, PHE started to look at how that would affect the estimates of deaths and hospital admissions.
In updating the AAFs, PHE found 29 published papers containing data that updated the previous relative risks for a number of cancers, cardiovascular diseases, and liver diseases. But there were no updates for epilepsy, pneumonia, and accidents.
Using the new method, there are almost 1 million alcohol-related hospital admissions each year in England. What matters most is that we can reliably compare one year to the next so that we can measure progress and identify trends. For that reason, it is better to change the methods from time to time but not every year.
So how much of a difference does this make to the figures?
Around 1 in 4 adults drinks alcohol in a way that increases their risk of an alcohol-related condition in their lifetime. This rough proportion has been fairly steady for many years, despite relatively small increases in the number of people who don’t drink at all and small reductions in the number of people who drink above the low risk guidelines.
What has changed is the estimated number of deaths and hospital admissions that are attributed to alcohol for some alcohol related diseases and conditions. Using our new method, our estimate for last year is approximately 23% lower than the estimate we had made previously.
There is no change to the number of alcohol-specific deaths or hospital admissions.
Doesn’t this mean alcohol is less harmful than we thought?
Even though the estimated numbers of alcohol related mortality and ill health may have decreased based on the new methodology, this is measured at a population level and the risk of alcohol consumption to the individual has not changed at all.
At an individual level, the threshold for health risk from alcohol has not changed from that laid out in the UK Chief Medical Officers' Low Risk Drinking Guidelines in 2016. This guidance recommended that to keep the lifetime risk of alcohol-related ill health to a minimum, adults should not regularly drink more than 14 units of alcohol per week, spread out over 3 or more days. Because the level of risk is directly related to the amount of alcohol consumed, the more this guideline is exceeded, the more risk is incurred.
Broadly speaking, people drinking fewer than 15 units per week are exposed to no greater risk than the average background risk from day to day life. Men drinking 15 to 49 units per week and women drinking 15 to 35 units per week are at significantly increased risk of alcohol harm. Men drinking more than 50 units or women drinking more than 35 units per week are very likely already to be experiencing health damage due to alcohol.
1. Forouzanfar MH, Alexander L, Anderson HR, Bachman VF, Biryukov S, Brauer M, et al. Global, regional, and national comparative risk assessment of 79 behavioural, environmental and occupational, and metabolic risks or clusters of risks in 188 countries, 1990–2013: a systematic analysis for the Global Burden of Disease Study 2013. Lancet. 2015;386(10010):2287–323.